Solar energy has become one of the fastest-scaling power technologies in history, driven by relentless cost declines, massive manufacturing scale, and rapid deployment across utility, commercial, and residential segments.
The numbers below highlight how quickly solar PV capacity, generation, investment, and employment have grown—and where momentum is heading next.
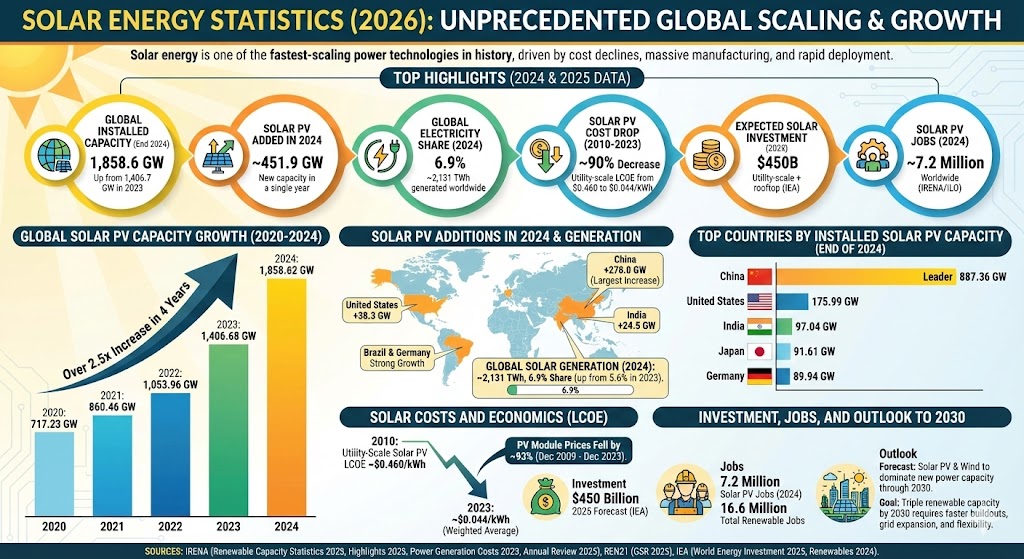
Global installed solar PV capacity:1,858.6 GW at end of 2024 (up from 1,406.7 GW in 2023).
Solar PV added in 2024: about 451.9 GW of new capacity in a single year.
Solar’s share of global electricity (2024):6.9%, with about 2,131 TWh generated worldwide.
Utility-scale solar PV LCOE (2023):$0.044/kWh globally (weighted average for newly commissioned projects).
Solar PV cost drop since 2010: global weighted-average utility-scale LCOE fell from $0.460/kWh (2010) to $0.044/kWh (2023), about a 90% decrease.
Expected solar investment (2025):$450B (utility-scale + rooftop), per IEA.
Solar PV jobs (2024): about 7.2 million worldwide (IRENA/ILO).
Total renewable energy jobs (global): at least 16.6 million (IRENA/ILO, annual review 2025).
Largest installed solar PV market (end-2024):China with about 887.4 GW installed.
Global Solar PV Capacity Growth
Global solar PV capacity rose from 717.2 GW in 2020 to 1,858.6 GW in 2024—about a 2.59× increase in four years. The 2024 total also implies year-over-year growth of roughly 452 GW from the 2023 base.
Chart: Global Installed Solar PV Capacity (End of Year)
Solar PV delivered the bulk of renewable capacity expansion in 2024, with IRENA reporting about 451.9 GW of solar PV added globally. The largest single-country increase came from China (+278.0 GW), followed by the United States (+38.3 GW) and India (+24.5 GW), with strong growth also in markets like Brazil and Germany.
Solar Electricity Generation
Capacity growth is translating into electricity output: REN21 reports that global solar PV generation reached about 2,131 TWh in 2024, representing 6.9% of global electricity generation (up from 5.6% in 2023).
Top Countries by Installed Solar PV Capacity (End of 2024)
Installed capacity is highly concentrated. China’s solar PV fleet is now several times larger than any other country’s, while the United States leads the next tier, followed by large markets such as India, Japan, and Germany.
Chart: Installed Solar PV Capacity by Country (End of 2024)
Label
Bar
Value
China
887.36 GW
United States
175.99 GW
India
97.04 GW
Japan
91.61 GW
Germany
89.94 GW
Max = 887.36 GW. Widths: China 100.00%, United States 19.83%, India 10.94%, Japan 10.32%, Germany 10.14%.
Solar Costs and Economics
Solar’s scale-up is inseparable from its cost curve. IRENA estimates the global weighted-average LCOE for newly commissioned utility-scale solar PV at $0.044/kWh in 2023, down from $0.460/kWh in 2010 (about a 90% decline). IRENA also reports that PV module prices fell by around 93% between December 2009 and December 2023, which has been a major driver of system cost reductions.
Investment and Jobs
Capital flows and employment are now measured at “major industry” scale. The IEA expects solar investment (utility + rooftop) to reach about $450 billion in 2025. On the labor side, IRENA/ILO estimate at least 16.6 million renewable energy jobs globally, with solar PV employment around 7.2 million in 2024.
Outlook to 2030
Forecasts still point to solar PV doing the heavy lifting for new power capacity through 2030. The IEA’s renewables market analysis projects global annual renewable capacity additions rising from 666 GW in 2024 to almost 935 GW by 2030, with solar PV and wind making up the vast majority. Separately, IRENA notes that maintaining 2024’s pace alone is not enough to hit the global goal to triple renewable power capacity by 2030, underscoring the need for faster buildouts, grid expansion, and flexibility (storage, demand response, and transmission).
Sources
IRENA — Renewable capacity statistics 2025 (PDF): https://www.irena.org/-/media/Files/IRENA/Agency/Publication/2025/Mar/IRENA_DAT_RE_Capacity_Statistics_2025.pdf
IRENA — Renewable Capacity Highlights 2025 (PDF): https://www.irena.org/-/media/Files/IRENA/Agency/Publication/2025/Mar/IRENA_DAT_RE_Capacity_Highlights_2025.pdf
REN21 — GSR 2025, Solar PV (2024 generation and share): https://www.ren21.net/gsr-2025/technologies/solar-pv/
IRENA — Renewable power generation costs in 2023 (Executive summary PDF): https://www.irena.org/-/media/Files/IRENA/Agency/Publication/2024/Sep/IRENA_Renewable_power_generation_costs_in_2023_executive_summary.pdf
IEA — World Energy Investment 2025 (Executive summary): https://www.iea.org/reports/world-energy-investment-2025/executive-summary
IRENA — Renewable energy and jobs: Annual review 2025 (publication page): https://www.irena.org/Publications/2026/Jan/Renewable-energy-and-jobs-Annual-review-2025
IRENA/ILO — Renewable energy and jobs: Annual review 2025 (PDF): https://www.ilo.org/sites/default/files/2026-01/IRENA_SOC_RE_and_jobs_2026.pdf