Solar panels (photovoltaic modules) are at the center of the world’s fastest-growing source of new electricity capacity. The last two years have been shaped by record deployment, big efficiency gains, and a manufacturing oversupply that pushed module prices sharply lower.
Solar Panel Statistics (Top Highlights)
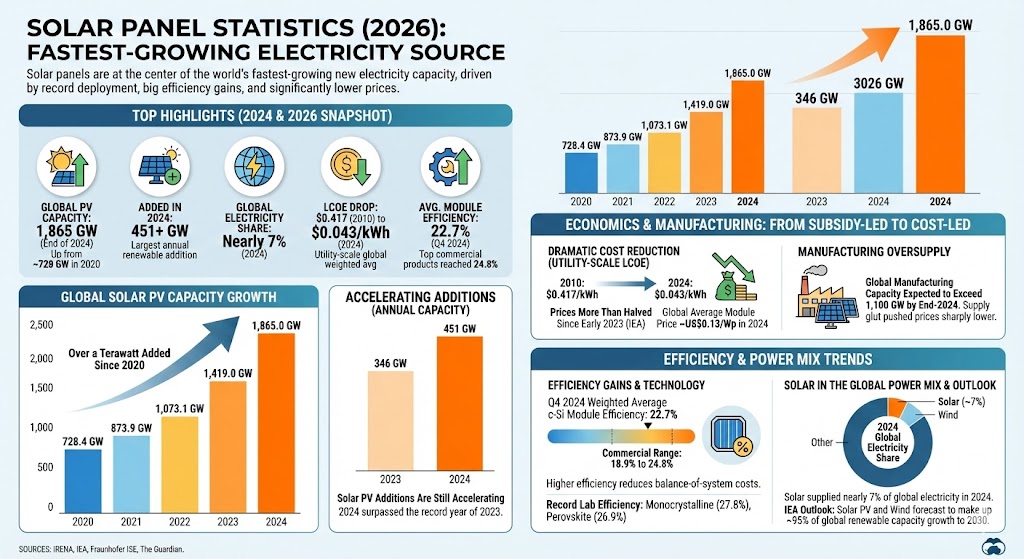
- Global solar PV capacity reached 1,865 GW by the end of 2024.
- Solar PV added 451+ GW in 2024 (the largest annual addition of any renewable source).
- Solar PV added 346 GW in 2023 (then a record year).
- Global solar PV capacity was ~1,419 GW at the end of 2023 (up from ~728 GW in 2020).
- Utility-scale solar PV LCOE fell from $0.417/kWh (2010) to $0.043/kWh (2024) (global weighted average).
- Global solar manufacturing capacity was expected to exceed 1,100 GW by end-2024, contributing to a supply glut.
- PV module prices more than halved since early 2023 amid oversupply (per IEA commentary).
- Crystalline-silicon (c-Si) modules averaged 22.7% efficiency in Q4 2024 (shipment-weighted); top products reached 24.8%.
- Global average PV module selling price was ~US$0.13/Wp in 2024 (industry snapshot).
- Solar supplied nearly 7% of global electricity in 2024 (as reported from Ember’s analysis in major media coverage).
Global Solar PV Capacity
Global solar PV capacity has risen extremely quickly, with the 2020–2024 period alone adding more than a terawatt of operating PV. Capacity in 2020–2023 comes from IRENA’s capacity statistics tables (reported in MW), while the end-2024 total comes from IRENA’s 2025 capacity highlights (reported in GW).
Chart: Global cumulative solar PV capacity (end of year)
| Label | Bar | Value |
|---|---|---|
| 2020 | 728.4 GW | |
| 2021 | 873.9 GW | |
| 2022 | 1,073.1 GW | |
| 2023 | 1,419.0 GW | |
| 2024 | 1,865.0 GW |
Max = 1,865.0 GW. Widths: 2020 39.06%, 2021 46.86%, 2022 57.54%, 2023 76.08%, 2024 100.00%.
Solar PV Additions Are Still Accelerating
In 2023, solar PV accounted for a record 346 GW of new capacity additions (within renewables). In 2024, solar additions rose again to 451+ GW, helping take global PV capacity to 1,865 GW.
Chart: Annual new solar PV capacity added
| Label | Bar | Value |
|---|---|---|
| 2023 | 346 GW | |
| 2024 | 451 GW |
Max = 451 GW. Widths: 2023 76.72%, 2024 100.00%.
Solar Panel Pricing and Economics
The economics have shifted from “subsidy-led” to “cost-led” in many markets. Two data points summarize why: (1) the global weighted-average cost of electricity from new utility-scale PV has fallen dramatically, and (2) module prices moved lower again after the 2022 supply-chain spike.
- Utility-scale solar PV LCOE: global weighted-average fell from $0.417/kWh (2010) to $0.043/kWh (2024) (about $43/MWh).
- Module pricing snapshot: global average selling price was about $0.13/Wp in 2024 (industry summary).
- Oversupply effect: the IEA reports module prices more than halved since early 2023, pressuring manufacturer margins.
Solar Panel Efficiency and Technology Trends
Efficiency gains matter because they reduce balance-of-system costs (racking, labor, wiring) per watt. Modern commercial modules are much more efficient than a decade ago, and the best mainstream products keep pushing higher.
- Shipment-weighted c-Si module efficiency: 22.7% (Q4 2024) vs 21.6% (Q4 2023).
- Commercial range (top manufacturers): 18.9% lowest to 24.8% highest (Q4 2024 snapshot).
- Record lab cell efficiencies (selected): monocrystalline wafer-based cells at 27.8%; perovskite cells at 26.9% (lab records summary).
Manufacturing and Supply Chain
Manufacturing has scaled faster than demand. The IEA expects global solar manufacturing capacity to exceed 1,100 GW by the end of 2024, which helps explain why panel prices dropped so quickly and why some upstream projects were cancelled or delayed.
Solar’s Role in the Power Mix
Solar is no longer a niche source of electricity. Based on Ember’s global electricity analysis as reported in major coverage, solar produced nearly 7% of the world’s electricity in 2024, alongside wind at just over 8%.
Outlook
Most medium-term forecasts still show solar PV and wind doing the bulk of new power-capacity growth. The IEA projects global annual renewable capacity additions rising from 666 GW in 2024 to almost 935 GW in 2030, with solar PV and wind making up about 95% of the growth.
Sources
- International Renewable Energy Agency (IRENA) – Record-Breaking Annual Growth in Renewable Power Capacity (press release, 26 March 2025): https://www.irena.org/News/pressreleases/2025/Mar/Record-Breaking-Annual-Growth-in-Renewable-Power-Capacity
- IRENA – Solar energy (technology overview, includes 2024 PV capacity, 2024 additions, and LCOE trend): https://www.irena.org/Energy-Transition/Technology/Solar-energy
- IRENA – Renewable Capacity Statistics 2024 (PDF, includes global solar PV capacity through 2023): https://www.irena.org/-/media/Files/IRENA/Agency/Publication/2024/Mar/IRENA_RE_Capacity_Statistics_2024.pdf
- International Energy Agency (IEA) – Renewables 2024 Executive Summary (solar manufacturing capacity and price trends): https://www.iea.org/reports/renewables-2024/executive-summary
- IEA – Renewables 2024: Electricity (renewables additions outlook to 2030): https://www.iea.org/reports/renewables-2024/electricity
- Fraunhofer ISE – Photovoltaics Report (PDF, module efficiency and pricing snapshots): https://www.ise.fraunhofer.de/content/dam/ise/de/documents/publications/studies/Photovoltaics-Report.pdf
- The Guardian – Clean energy powered 40% of global electricity in 2024, report finds (8 April 2025): https://www.theguardian.com/business/2025/apr/08/clean-energy-powered-40-of-global-electricity-in-2024-report-finds